Welcome to FABRIC Infrastructure Metrics

Members of FABRIC Testbed projects can view a wide variety of metrics gathered from the testbed infrustructure.

Grafana is used to visualize the metrics and to make metric discoveries easier.

You can go to Grafana or choose a link below to go directly to dashboards of interest.

To view metrics on this site you must be logged in as a FABRIC user.

Login
FABRIC Bandwidth Usage Graphs

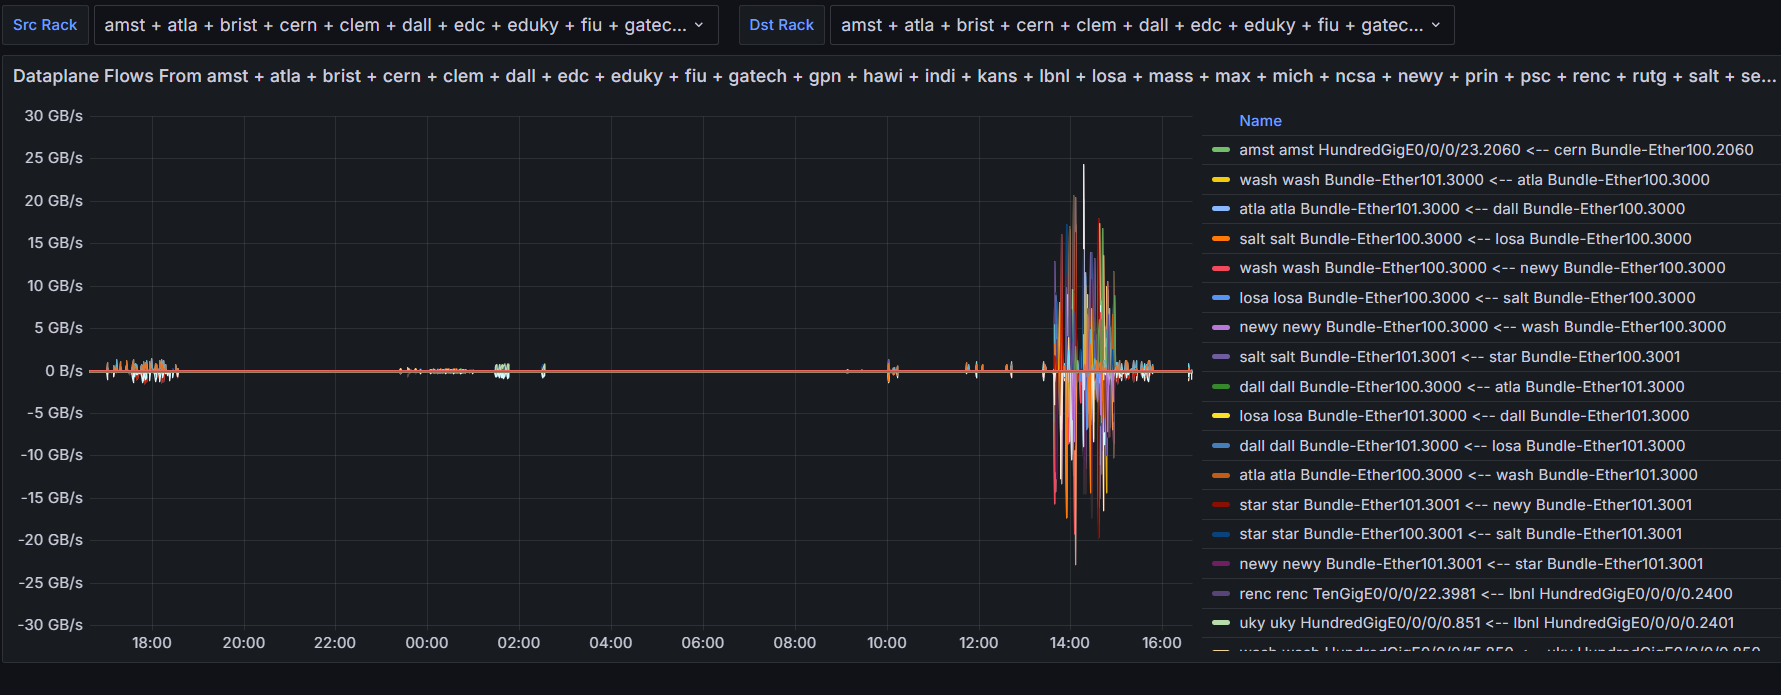
Link Traffic Graph

Link Traffic Graph

See the network traffic between adjacent (directly-connected) FABRIC racks. Select the source and/or destination rack(s) of interest to plot the bandwidth used during a specified time period.

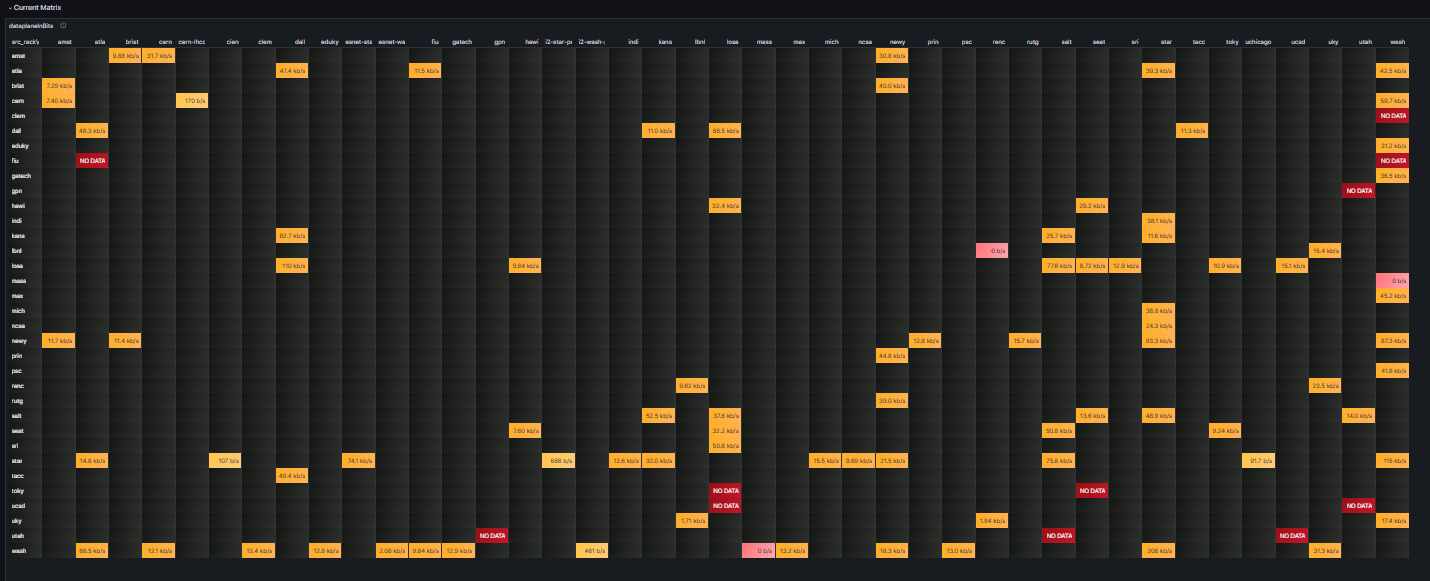
Link Status Matrix

Current Link Status

Display an overview of the current link status (usage and/or failure status) as a traffic matrix. The most used (Top) and least used (Bottom) links are shown at the bottom of the page.

FABRIC Node Measurements

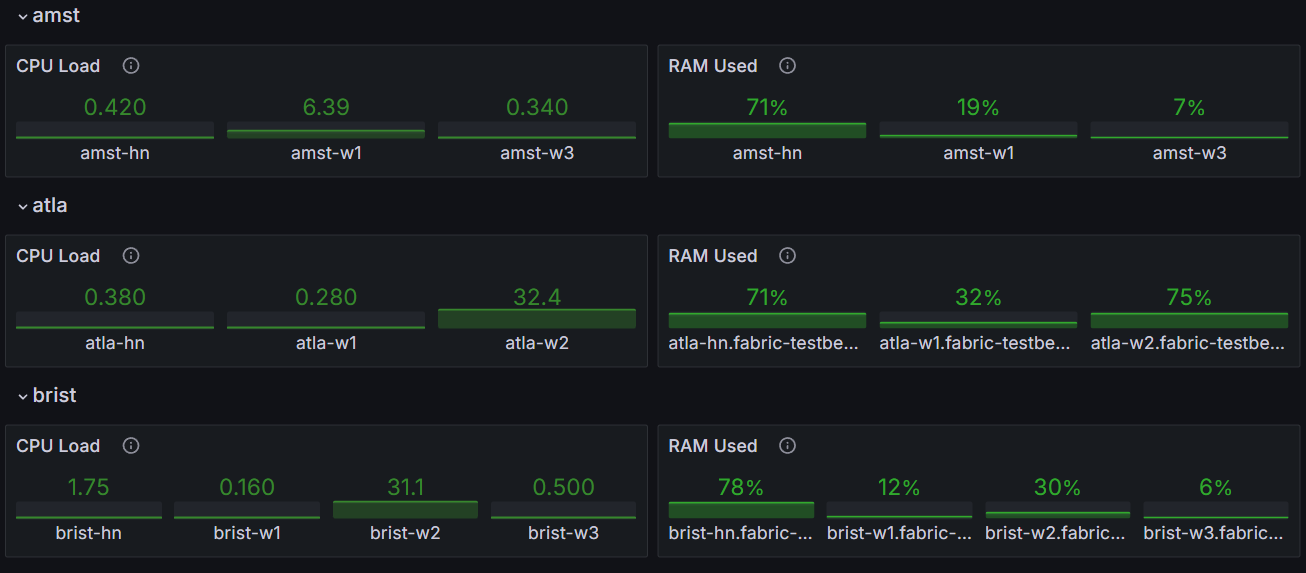
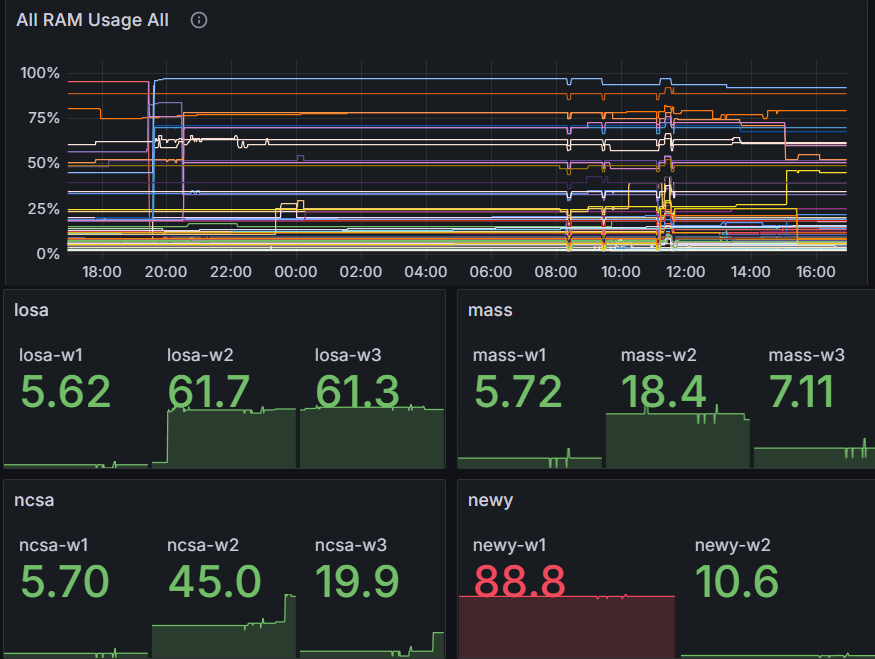
CPU RAM Usage

Rack Health Information

See a concise visualization of the current CPU and RAM health for every node in every rack. Pick and choose which racks to show and compare. Also see the time series graph with the most and least used CPU load and RAM usage.

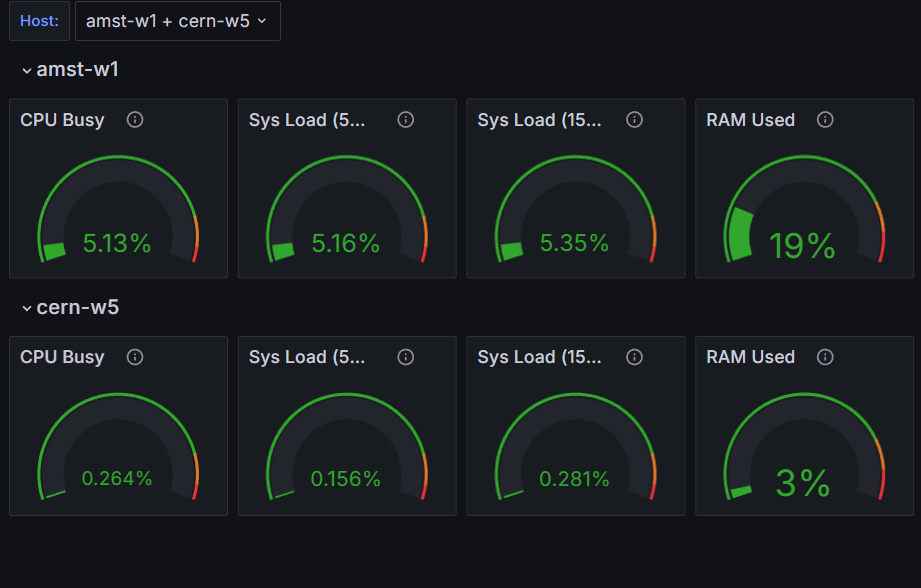
Basic Node Summary

Basic Node Measurements

See basic health information for every node in every rack. Pick and choose which racks to show and compare.

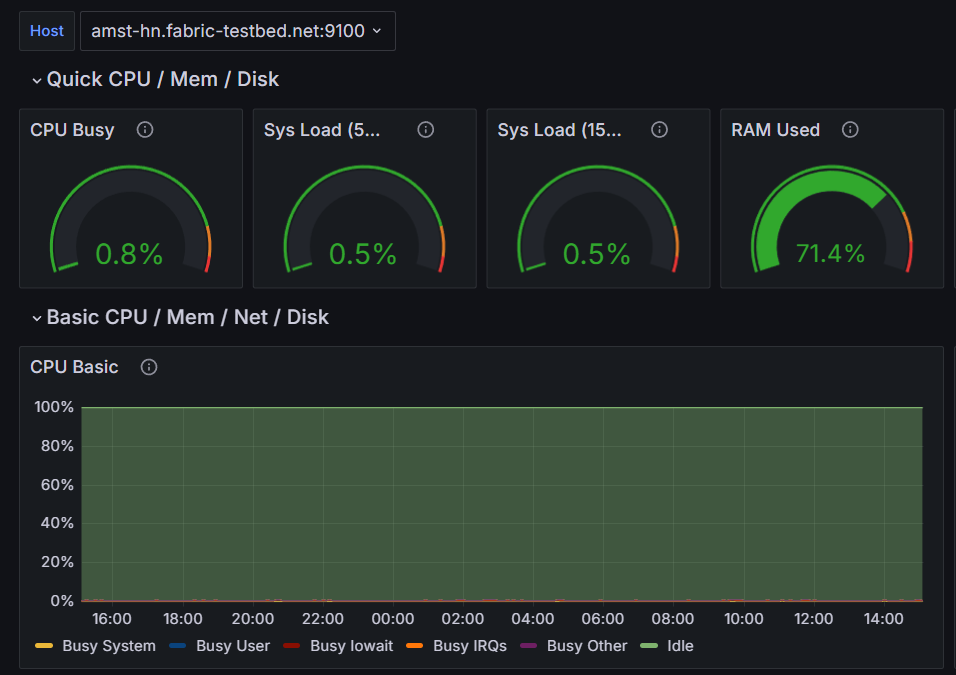
Full Node Exporter

Detailed Node Measurements

See an extensive list of measurements being collected at each node. This dashboard provides detailed information about the performance of a node (select the node in the upper left hand corner). Specific time ranges can be selected in the upper right hand corner.

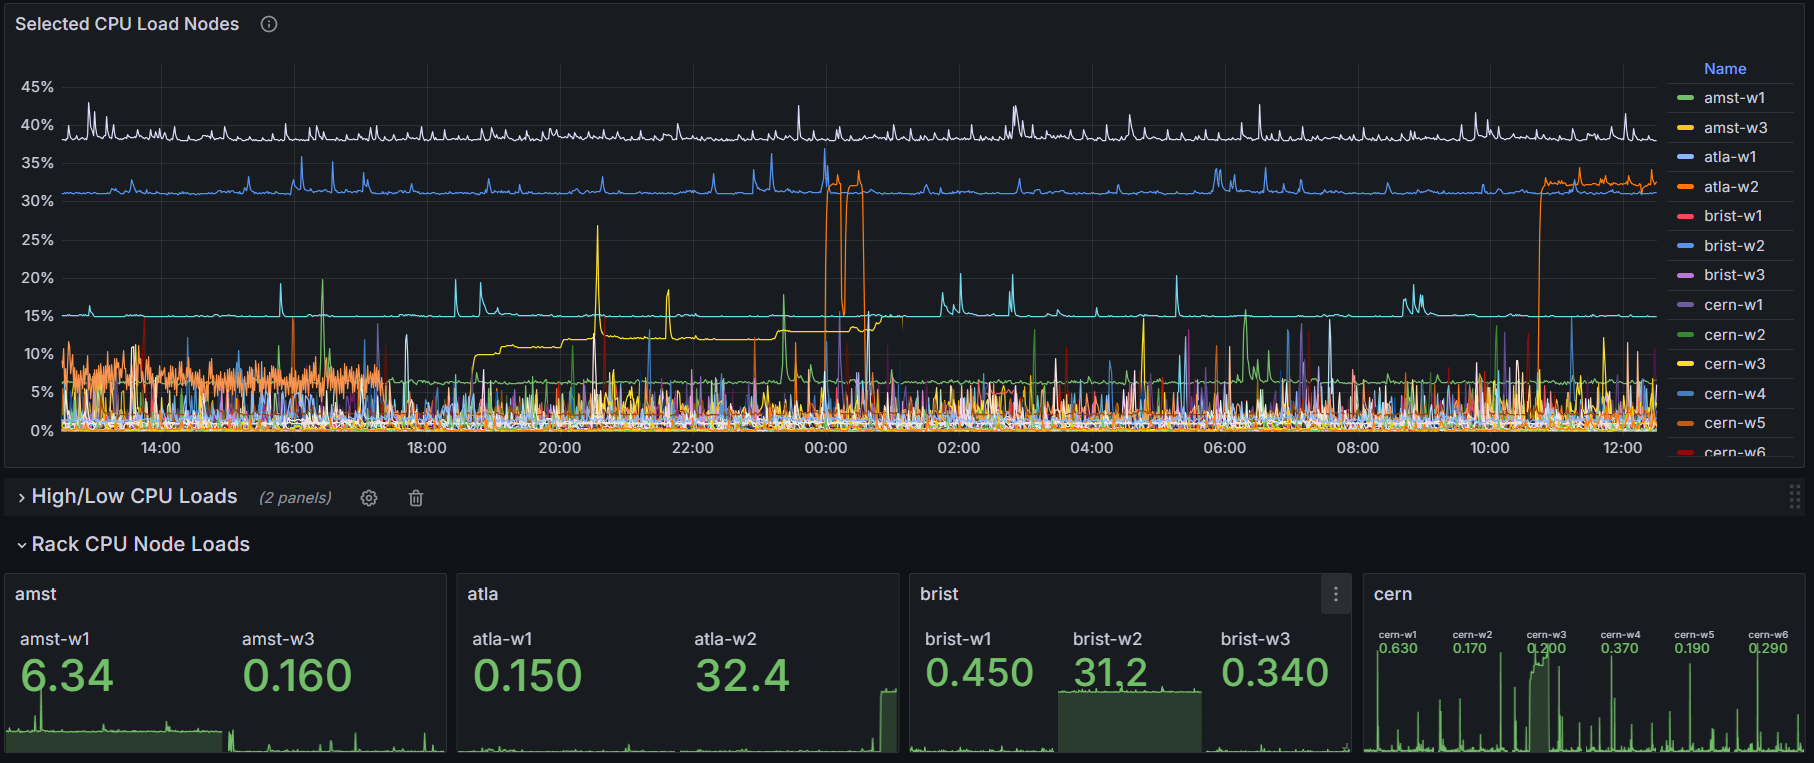
CPU Load

CPU Load Per Node

See the CPU loads on FABRIC nodes. Select which nodes to view. 1, 5 and 15 minute loads are available.

RAM Usage

Node RAM Usage

See the RAM usages details for all or selected FABRIC Nodes.

Port Graph

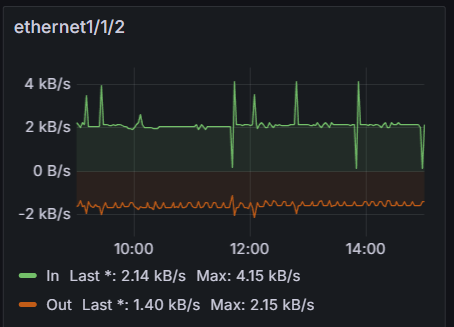
Node Port Traffic

See the bandwidth being used by each port on the FABRIC nodes and switches

Other Measurement Examples

Temperature Graph

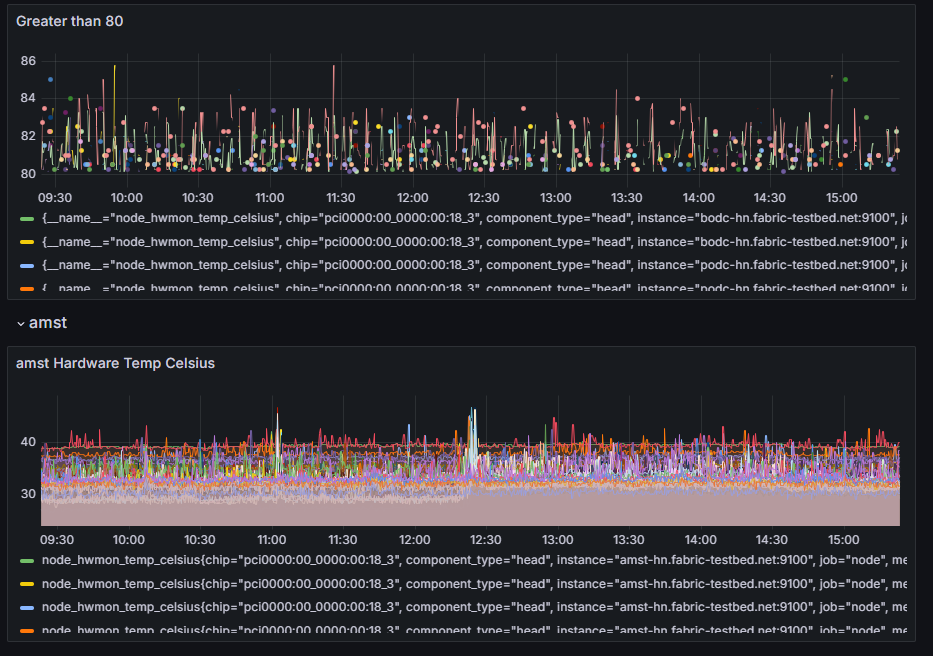
Finding Node Temperatures

Learn how to find and display Node temperatures.

Explore Metrics

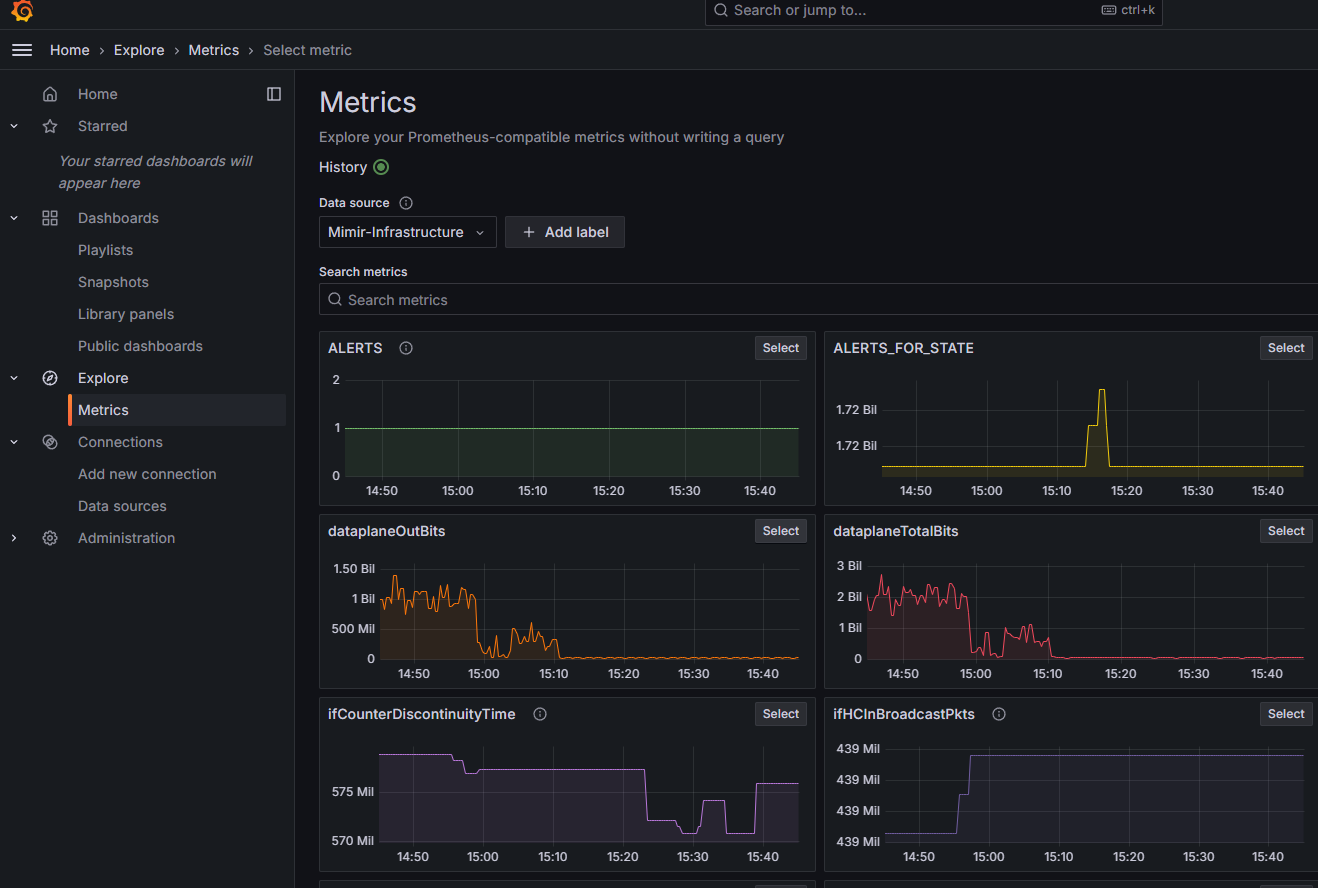
Exploring the Set of Available Metrics

Learn how to browse through the long list of measurements being collected by the FABRIC Measurement Infrastructure.

Service Slice

One Way Latency (OWL)

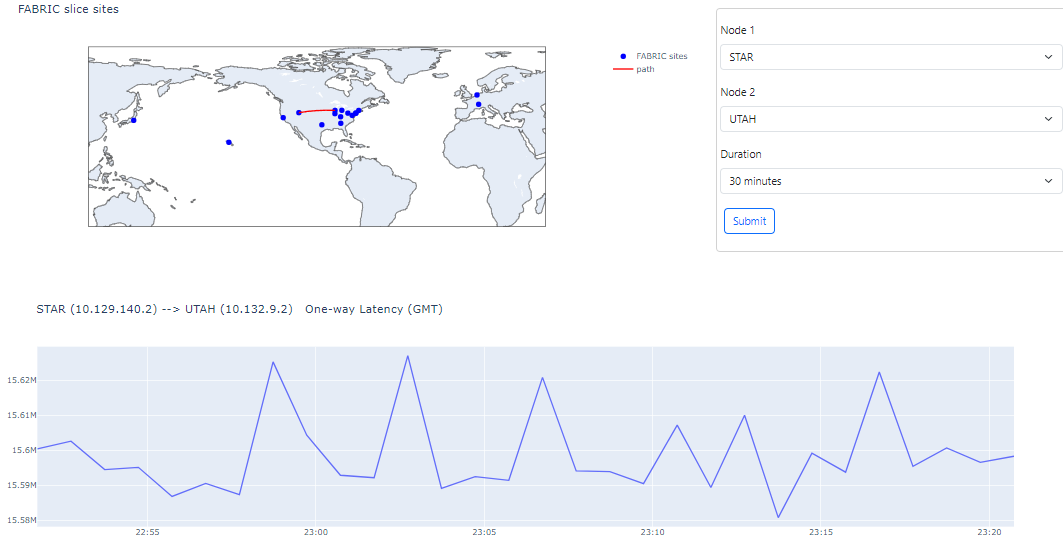
One Way Latency

See one way latency (OWL) measurements between FABRIC racks equipped with GPS timing and precision time protocol(PTP). Redirects to public-metrics.fabric-testbed.net site.